Know when your services break
Ingest health signals from any system. Get alerted instantly. Track uptime over time. Simplified monitoring for SaaS.
Everything you need to stay on top
Simple by design. Powerful when you need it.
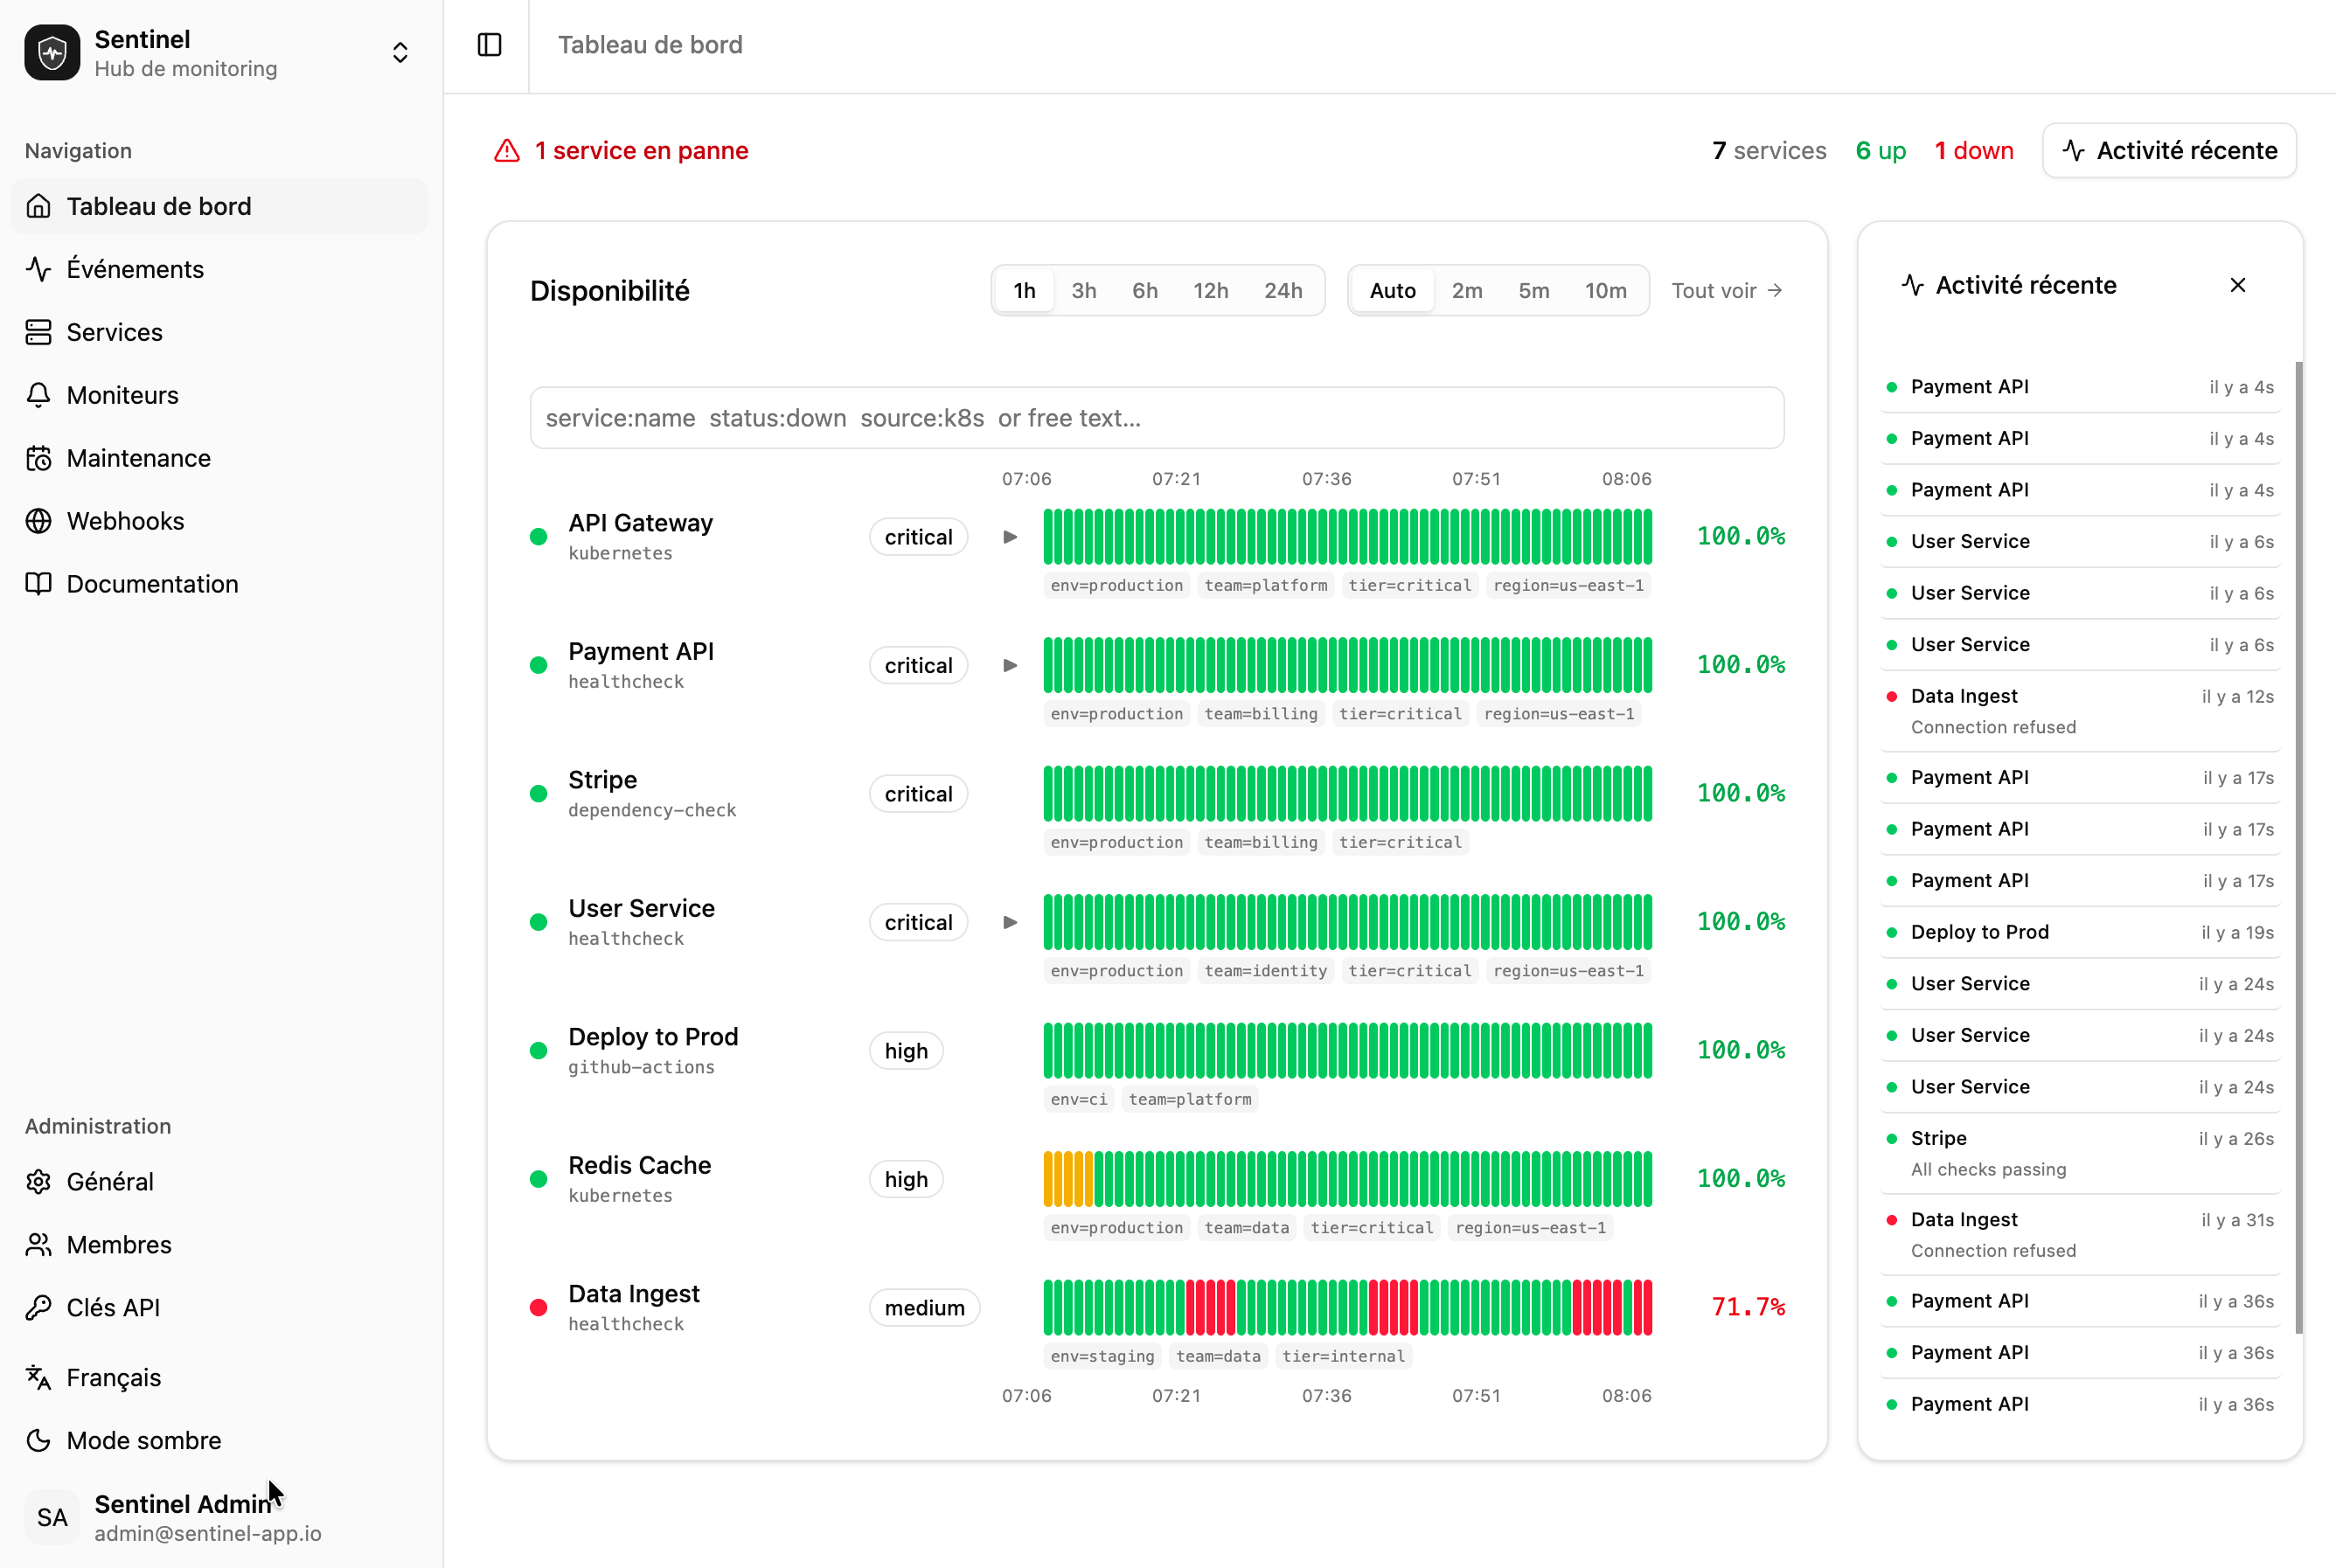
Instant Alerts
Get notified on Slack, email, or webhook the moment a service degrades or goes down.
Source-Agnostic
Accept signals from any system — CI, cron, Prometheus, Grafana, custom scripts. One endpoint, any source.
Auto-Discovery
Services are created automatically on first signal. No manual setup needed.
Labels & Dynamic Scoping
Tag services automatically from signal metadata. Set priority on ingestion. Scope monitors by labels instead of hard-coding service lists.
SLA Tracking (soon)
Define uptime commitments and track compliance over time. Know your error budget at a glance.
How it works
Three steps. No agents to install.
Send
Push health signals from any system via a single API endpoint or webhook.
Get alerted
Sentinel detects status changes and notifies you instantly via Slack, email, or webhook.
Track over time
Monitor uptime over time and identify trends before they become incidents.
Native Kubernetes Monitoring
Deploy the operator once. Annotate your workloads. Sentinel takes care of the rest.
Workload health, not pod noise
Monitors Deployments, StatefulSets and DaemonSets directly. Reports health based on ready vs desired replicas — not individual pod events.
Rolling update detection
Knows when a rollout is in progress and reports it as metadata. No false alerts during deploys.
Three health states
Up (all pods ready), Degraded (partial availability), Down (no pods ready). Tracked over time with uptime history.
Multi-component services
Multiple workloads with the same service slug are tracked as components. Expand the uptime bar to see per-component health breakdown.
Install the operator
helm install sentinel-operator \
  oci://ghcr.io/sentinel-app-io/charts/sentinel-operator \
  --namespace sentinel --create-namespace \
  --set credentials.sentinelUrl=https://app.sentinel-app.io \
  --set credentials.keyId=your-key-id \
--set credentials.secret=your-secretAnnotate your workloads
apiVersion: apps/v1
kind: Deployment
metadata:
  name: payment-api
  annotations:
    sentinel.io/monitor: "true"
    sentinel.io/service: "payment-api"
    # sentinel.io/component: "api"  # optional override
Send a Signal in Any Language
One endpoint, any language. Report your service health in a single HTTP call.
curl -X POST https://app.sentinel-app.io/api/v1/signals/ \
  -H "Content-Type: application/json" \
  -H "STNL-Access-Key: $KEY_ID" \
  -H "STNL-Secret-Key: $SECRET" \
-d '{"service": "my-api", "status": 1}'Works with any language that can make HTTP requests. See the full documentation for more examples.